How Do Spaghetti Models Predict a Hurricane's Path?

By: Patrick J. Kiger  | 
Ida spaghetti models
Spaghetti models for Tropical Storm Ida show its path crossing the Caribbean Sea, into the Gulf of Mexico and making landfall somewhere along the U.S. Gulf Coast Monday Aug. 30, likely as a major hurricane. cyclocane/CC BY 3.0

If you're living in a coastal area prone to hurricanes and major tropical storms, you may not be all that interested in the statistical and meteorological big picture behind storm prediction. What you really want to know is what a particular hurricane is going to do — what its path is going to be, and when it's going to strike your area.

As the Atlantic hurricane season began June 1, 2022 (it runs through Nov. 30), the National Oceanic and Atmospheric Association (NOAA) predicted between 14 and 21 storms that would be big enough to merit names, with winds of 39 miles per hour (63 kilometers per hour) or greater.

Advertisement

However NOAA updated that forecast Aug. 4, to 14 to 20 named storms, three to five of those it's predicting will be Category 3, 4 or 5 hurricanes with winds 111 miles per hour (179 kilometers per hour) or faster.

Spaghetti Models and Forecasting

To aid in forecasting efforts, meteorologists utilize visualizations called spaghetti models (also sometimes known as spaghetti plots). To a lay person, spaghetti models look like, well, a bunch of spaghetti strands thrown randomly against a wall. In reality, though, spaghetti plots are a method of combining information from a variety of predictive models onto one map, to come up with a picture of a hurricane's potential track.

"Each model that is used to predict hurricane paths — and in many cases intensity — can have that path plotted on a map," Daniel J. Leathers explained when we spoke to him in 2019. He's a professor and director of the Meteorology and Climatology program at the University of Delaware, who also serves as Delaware State Climatologist and as a co-director of the Delaware Environmental Observing System. "All a spaghetti plot does is take the results from all of these models and plot all of them on the same map."

Advertisement

To understand why spaghetti plots are important, you have to understand that there are a whole bunch of different modeling methods that are used to track hurricanes, and like presidential election polls, they don't all produce the same results.

The object of creating such a map, according to Leathers, is to see the extent to which all the different models agree. "When the paths are very similar to one another, this means that all the models are agreeing (to a large extent) about the future path of the storm," he says. In contrast, if the individual plots are all over the place, "then that says that there is great uncertainty in the models about where the storm will move in the future. Spaghetti plots are a way of seeing all of the model results at one time, and not relying on just one model for a forecast. They are very helpful in conveying the certainty, or uncertainty, of a forecast."

Spaghetti models
Spaghetti models, or spaghetti maps, show many different potential tracks of a tropical system's trajectory, helping forecasters to determine a storm's eventual path.
South Florida Water Management District

Advertisement

Reading Spaghetti Models

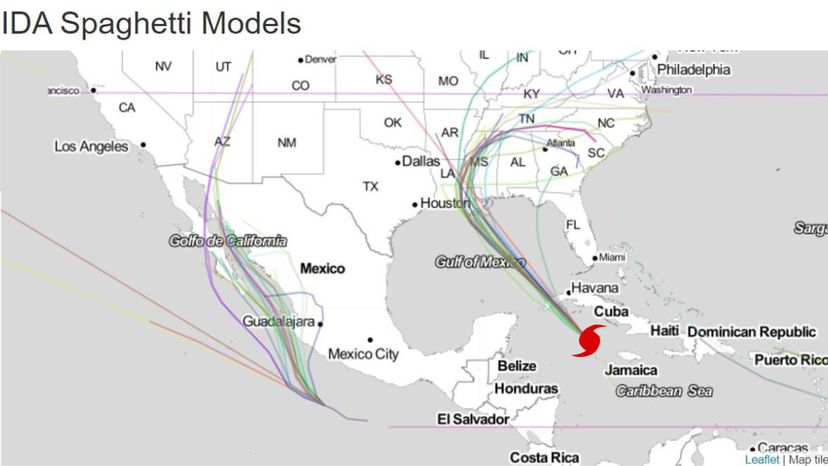
The lines on the chart indicate the different paths projected by the various models, which have varying degrees of reliability. "The models include dynamical models (using the physics of the atmosphere), statistical models and in some cases analogue models to predict the coming movement of an individual storm," Leathers explains. "These models come from meteorological organizations from all across the globe — places like the National Weather Service, the British Met Office, universities and so on. Some models are certainly thought to be better than others. They are very different in how they make predictions, and in what they are best at."

What, if any, useful information can non-meteorologists get from looking at spaghetti plots? "The most useful information is the certainty of the forecast," Leathers explains. "Again, if all the paths are very similar, the forecast certainty is high. If the paths are very different, the certainty is low. If there is a great spread in the forecast tracks then that shows that the models are not doing a great job as a suite in figuring out where this particular storm is likely to move in the future."

Advertisement

But if you're going to try to make sense of spaghetti plots, it's important to understand their limitations. "Non-meteorologists do need to be careful in interpreting the plots, as some models generally do better than others at different times in the storms life-cycle," Leathers says. "This can be important information to get the most from a spaghetti plot."

Spaghetti models have changed subtly over the years, according to Leathers. The approach has evolved as more hurricane models are run in real-time, and as technology has allowed us to put these models together into a spaghetti plot faster, he says. He says he doesn't expect anything to replace them in the foreseeable future.

"As technology allows for the more rapid transfer of data and as visualization technology goes, I am sure there will be some more changes," Leathers says. He also predicts that the number of models, and their sophistication, is likely to continue to grow in the years ahead.

Advertisement

Frequently Answered Questions

What do spaghetti models show?
Spaghetti models are a type of model used to predict the future path of a tropical cyclone.

Advertisement

Loading...