A Venn diagram is possibly the easiest type of diagram to understand — you can look at it and immediately see what's going on.
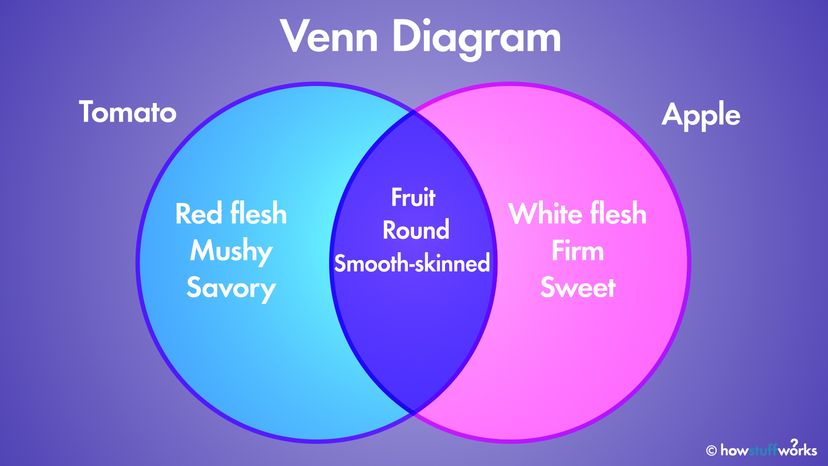
Let's just say you want to make a Venn diagram looking at the relationship between tomatoes and apples. First, you'd just make lists of descriptive terms about each:
- A tomato is red, mushy inside, red in the middle, round, savory tasting, smooth-skinned and a fruit.
- An apple is red, firm inside, white in the middle, round, sweet tasting, smooth-skinned and a fruit.
The next step is to draw two interlocking circles — in fact, you can use as many interlocking circles as you like, depending on how many things you want to compare.
One circle will be the tomato circle — listing all the traits of the tomato inside it — and the other will be the apple circle. The football-shaped place where the two circles overlap is where the traits shared by both will go: They're fruits, round and smooth-skinned.
Outside the middle section, the tomato side will include mushy insides, red in the middle and savory tasting, while the apple side will list the other apple traits: firm insides, white in the middle, sweet.
And that's a simple, slightly fruity explanation of the classic Venn diagram. Time for a snack!


