Raw data will only get you so far; you need descriptive statistics like IQR to help you understand what the data means. NickyLloyd / Getty Images
The interquartile range (IQR) is a statistical measure of the middle values of a sample data set that is separated into four equal parts. This middle-value grouping can provide a median range between the upper half and lower half of the data you've collected, allowing you to ignore extreme values.
You can focus quartile deviation even further into a semi-interquartile range that breaks interquartile ranges into more specific chunks, highlighting the central tendency of data point distribution. These quartile breaks must be made in one-half increments to maintain two equal parts in each sub-quartile.
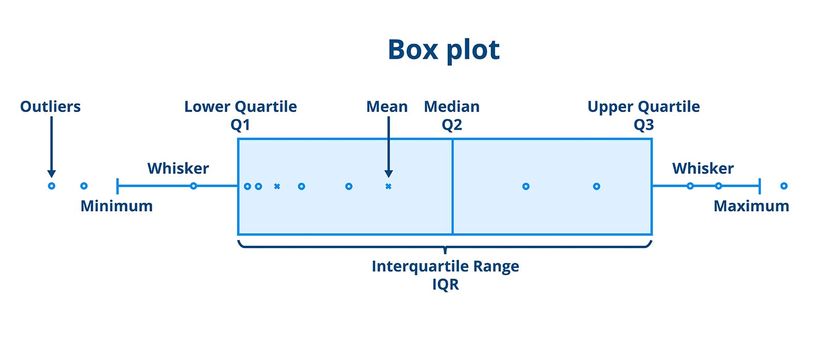
In statistics, the total range of individual points in a sample data set can extend from extreme outliers that don't clearly represent the average or median. In a horizontal box plot, the lowest value (minimum) is typically found on the left side of a graph, while the highest value (maximum) is found on the right.
An interquartile range calculator or formula helps to highlight a normal distribution and find the median, where greatest density of values lie in the central dataset spread. (Here's a refresher on the differences between mean, median and mode as averages or measures of central tendency.)
Advertisement
Someone might use these quartiles to organize statistics and find the standard deviation of test scores, home prices, and any number of other measurements.
What Is the First Quartile (Lower Quartile)?
The first quartile (Q1) is the first 25th percentile, in the lower half of data points. This first half of the dataset will measure the minimum range.
For example, a teacher can pinpoint the lowest of the two halves of a class' standard score to see which students are struggling and need more help than the average student.
Advertisement
What Is the Third Quartile (Upper Quartile)?
The third quartile (Q3), representing the 75th percentile of actual values, is found in the second half of the box plot. This second half of the data following the second quartile will measure a range of data points with maximum values larger than the median spread.
Advertisement
Use the First and Third Quartiles to Find the Interquartile Range
This box plot highlighting the interquartile range is a helpful way to visualize descriptive statistics. petrroudny43 / Shutterstock
Use the following steps to successfully complete an interquartile range formula and find the IQR.
Step 1: Organize the Data
To find interquartile range (IQR) within a data set, begin by ordering your values from least to greatest. The first quartile (Q1), or lower quartile, should contain statistics with the smallest values. This range is followed by the second, third and fourth quartiles that grow incrementally larger.
Advertisement
Step 2: Find the Median
Find the middle value by locating the apex of central tendency on the graph. This will be the center point between the upper quartile and lower quartile of the data set. This will be easy to spot if you have an odd number of data points. However, when dealing with an even number of data points, just take the average (mean) of the two middle values.
Step 3: Calculate the IQR
Identify the first and third quartiles. Subtract to find the difference between the upper and lower quartile (Q3 – Q1). Since the interquartile range (IQR) is calculated as the difference, double-check information found in the first or third quartiles by adding the equation back to its original values in their respective quartiles.
Now That's Shocking!
Statistics distribution can measure extreme values in a dataset spread to illustrate various interesting and bizarre occurrences in our world. For example, researchers have poured over a wide range of data to measure the likelihood that different animals will be struck by lightning. In their findings, researchers calculated that giraffes were 30 times more unlucky than humans in a thunderstorm.
Advertisement
Cite This!
Please copy/paste the following text to properly cite this HowStuffWorks.com article: