How the Environment Has Changed Since the First Earth Day 51 Years Ago

Earth Day 1970
The first Earth Day was celebrated in Union Square Park in New York City on April 22, 1970. Bettmann/Bettmann Archive/Getty Images

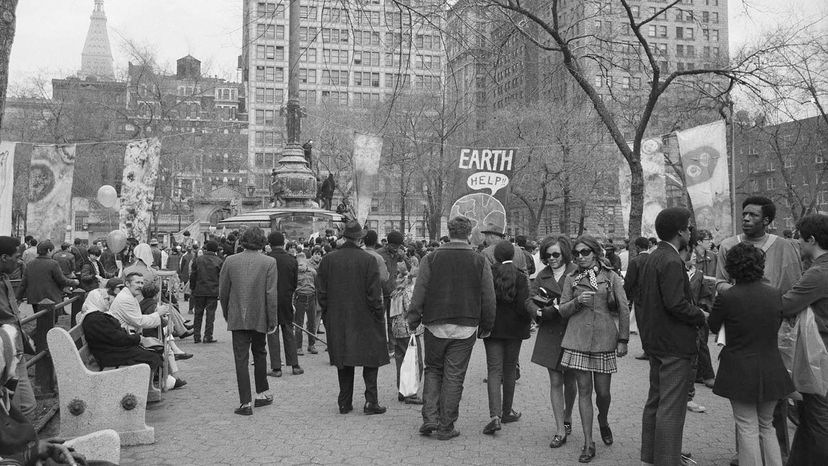
On April 22, 1970, millions of Americans took part in demonstrations, cleanups and other activities to make the first Earth Day. The event was the brainchild of then Democratic Senator Gaylord Nelson of Wisconsin, and it was a watershed moment for the growing U.S. environmental movement.

Americans had become increasingly aware that the same industrialization that had made the country wealthy was having an impact on the environment and their own health. As famed anchorman Walter Cronkite put it in a special CBS News broadcast, Earth Day participants had a "common cause of saving life from the deadly by-products of that bounty: the fouled skies, the filthy waters, the littered Earth."

Advertisement

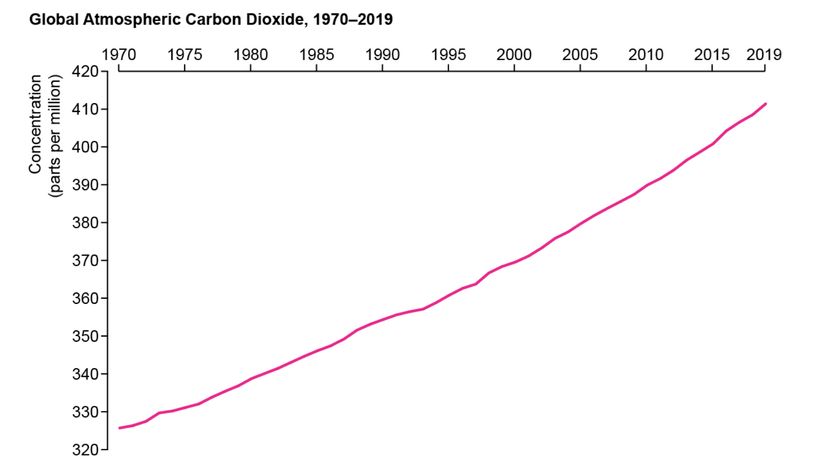
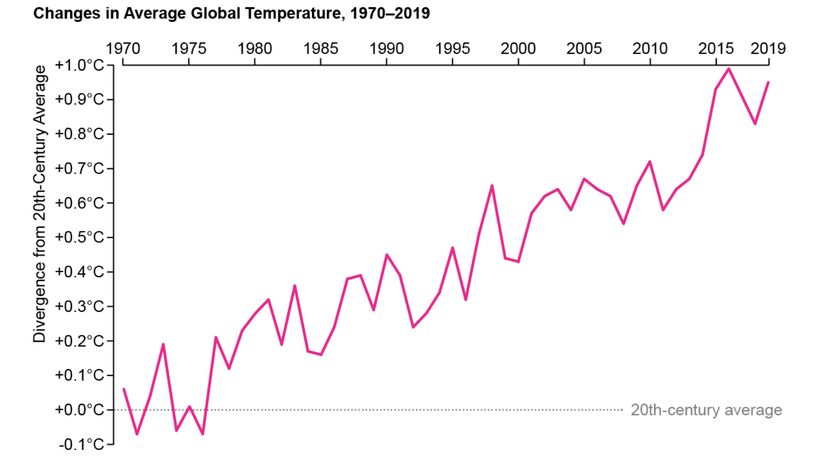
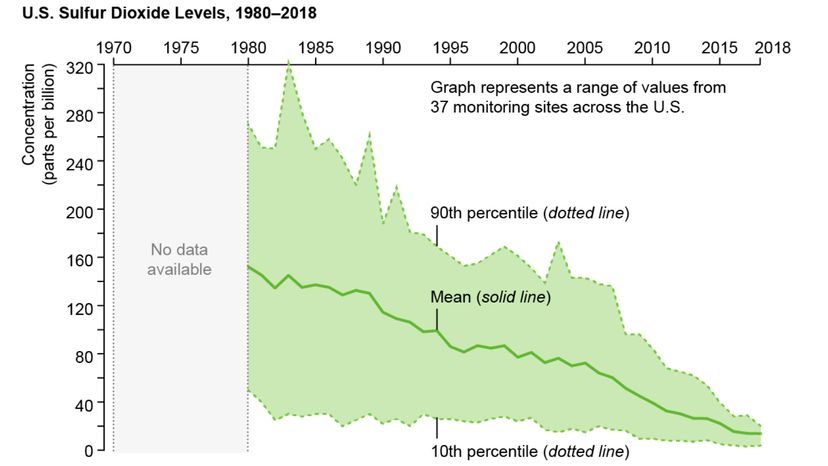
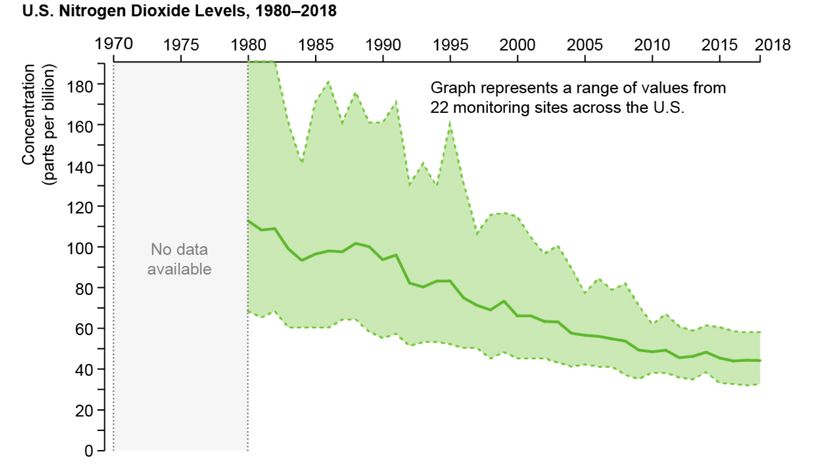
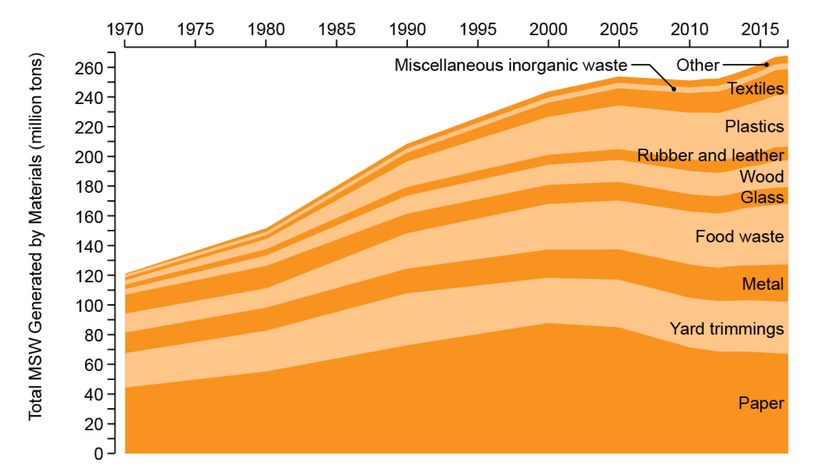
That same year would see the creation of the Environmental Protection Agency and the first in a series of important environmental laws. Since then efforts to tackle various environmental ills have waxed and waned. While enormous strides have been made in curbing air pollution, the threat of climate change has emerged and mushroomed. Here we take a look at a few environmental indicators to see what progress has — or has not — been made since that inaugural Earth Day 50 years ago.

Climate

The clear, inexorable rises of the curves in the two graphs below are at the heart of the global warming problem. As humans have piled more cars onto roads and burned more coal and natural gas for electricity, the amount of carbon dioxide in the atmosphere has steadily ticked upward.

The average atmospheric CO2 concentration now stands above 410 parts per million (ppm), compared with about 325 ppm in 1970 (and 280 ppm before the industrial revolution in the 19th century). The excess heat trapped by that CO2 has already raised global temperatures by about 1 degree Celsius since preindustrial times. Under the 2015 Paris climate accord, nations have agreed to limit total warming to no more than 2 degrees Celsius (3.6 degrees Fahrenheit) above preindustrial levels — with a preferred goal of staying below 1.5 degrees Celsius (2.7 degrees Fahrenheit). To date, emissions-curbing efforts have been unable to put the brakes on quickly enough to meet those targets.

Advertisement

Amanda Montañez; Source: National Oceanic and Atmospheric Administration

Advertisement

Air Pollution

Among the fundamental issues that drove Nelson and his colleagues to hold the first Earth Day was the rampant, deadly pollution clogging U.S. skies. One of the worst air pollution disasters in the nation's history came in the fall of 1948, when weather conditions caused a stew of smog to build up in the industrial town of Donora, Pennsylvania, sickening thousands and killing 20 people. Congress passed various laws to limit air pollution in the ensuing years, but the Clean Air Act of 1970 was the landmark legislation that truly ushered in the stringent and comprehensive regulation of emissions from power plants, factories and cars.

The graphs below show how the law and its subsequent revisions have led to notable nationwide drops in three major pollutants: nitrogen dioxide, sulfur dioxide and lead. Nitrogen dioxide and sulfur dioxide can be harmful to human health when breathed in, and both react with other chemicals in the atmosphere to create the particles that contribute to smog.

Advertisement

Lead is highly toxic and can cause neurological and cardiovascular problems. One of the key sources of airborne lead pollution in the mid-20th century was leaded gasoline; since it was phased out, beginning in the mid-1970s, lead levels have plummeted. Many environmentalists and scientists who study air pollution are concerned that the considerable progress over the past 50 years might be stalled — or even reversed — by actions the EPA has taken during the Trump administration to weaken air pollution rules and enforcement.

Amanda Montañez; Source: U.S. Environmental Protection Agency

Advertisement

Water

Perhaps the most emblematic moment of the crisis that afflicted U.S. waterways was the fire that erupted on the Cuyahoga River June 22, 1969. Effluent from industrial activity along the river, running from Akron, Ohio, to Cleveland, had provided fuel for more than a dozen fires since the mid-19th century and killed off the waterway's fish. The 1969 event helped lead to the passage of the Clean Water Act in 1972. Another landmark law, this act addressed pollution entering waterways from industry, sewage facilities and agriculture.

The graphs below highlights measurements from two major U.S. water bodies: Lake Michigan and Lake Erie. The first of them shows the change in levels of phosphorus — one of the key nutrients that fuel toxic algal blooms — carried into Lake Erie by the Maumee River, which flows into the lake in Toledo. Runoff from agricultural fields is the main contributor to the phosphorus load in the lake, which supplies drinking water to 11 million people. Researchers are actively working to figure out how farming practices might be changed to reduce the amount of phosphorus pouring in.

Advertisement

The graph for Lake Michigan shows a different type of pollutant: polychlorinated biphenyls (PCBs), which can cause cancer as well as other health effects. PCB production was banned in 1979. And although levels of the compounds in the air (from which these chemicals fall into the water) and in fish have declined, their presence is still high enough that some states warn people to limit consumption of fish from the lakes.

Credit: Amanda Montañez; Source: National Center for Water Quality Research, Heidelberg University (phosphorus data); Great Lakes Fish Monitoring and Surveillance Program and Great Lakes Integrated Atmospheric Deposition Network (PCB data)

Advertisement

Waste

Americans are producing a lot more garbage than they did 50 years ago — and not just because the country's population has risen: Each person in the U.S. generates an average of 4.5 pounds (2 kilograms) of waste a day, compared with just 3.25 pounds (1.4 kilograms) in 1970. What they throw away has also changed, with plastic waste making up a larger percentage than in the past.

That change reflects the explosion of plastic products over the past few decades, from less than 50 million tons (45 million metric tons) of the material produced in 1970 to more than 320 million tons (290 million metric tons) today. And though the recycling and composting of some materials have grown, a large chunk of trash still ends up in landfills: 139.6 million tons(129.6 million metric tons) of the 267.8 million tons (243.7 million metric tons) generated in 2017 (the last year for which data is available). That amount is, at least, a slight decline from the 145.3 million tons (131.8 million metric tons) dumped in landfills in 1990.

Advertisement

It is clear that the U.S. and the world have made strides in realizing humanity's impact and the need to safeguard the environment. But there is still a long way to go. As Nelson wrote in 1984, "The ultimate test of man's conscience may be his willingness to sacrifice something today for future generations whose words of thanks will not be heard."

Amanda Montañez; Source: U.S. Environmental Protection Agency

This story originally appeared in Scientific American and is republished here as part of Covering Climate Now, a global journalism collaboration strengthening coverage of the climate story.

Advertisement

Advertisement

Loading...