How Chaos Theory Works

snowstorm
The meteorologist predicts a snowstorm like this for the following day, but when the day arrives, there are no flakes in sight. Chaos theory can shed light on why forecasts fail. Grant Faint/Getty Images

It happened again. The local weatherman had predicted a major winter storm had set its sights on central Virginia. Precipitation would start the following morning, and we should expect 8 inches (20 centimeters) of the white stuff by evening. The weather service issued a winter storm warning, and red triangles popped up on my desktop and smartphone weather apps. My boys bounced around the house, celebrating the snow day that would soon be commandeered for sledding, loafing and video-game playing.

The next day dawned gray and brooding, and the local weather crew reiterated the previous night's forecast: The storm was still lurching its way northeastward. My boys climbed on the bus, smugly telling me they'd see me at noon, after an early school dismissal. But noon arrived without the slightest hint of precipitation. So did afternoon. When they stepped off the bus at 3:45, my boys glowered at the sky, all the while insisting that the storm had only been delayed. The next day would be a horror of snowdrifts, slick roads and power outages. Even the weatherman clung to the party line: The storm was still coming, although now we might expect just 3 or 4 inches (about 7-10 centimeters). Yet when we finally turned off the lights at 11:30 that evening, not a drop of moisture -- frozen or otherwise -- had fallen from the sullen skies draped over the Shenandoah Valley.

Advertisement

As you've guessed by now, the storm never came. We woke up the next morning to clearing skies and daily routines unaffected by snow. Years ago, we would have scoffed at the meteorologist's inability to make an accurate forecast. How could someone, with so much technology at his or her disposal, so much data to crunch in supercomputers, be wrong so much of the time? How could modern science continue to fail us so miserably?

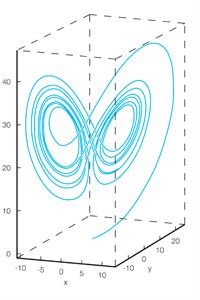
Now we know. The weatherman had fallen victim to chaos. Not the kind of chaos we remember from English class -- complete disorder and confusion. This is a property of highly complex systems, such as the atmosphere, the economy and populations of living things. Indeed, perhaps all systems, even those that seem to conform nicely to scientific laws as solid as bedrock, exhibit chaotic features. If that's true, then everything we know about everything is not necessarily wrong, but different. The ordered, obsequious universe we now take for granted may be the exception to the rule, instead of the other way around. At the very least, our glimpses of order could be byproducts of chaos, brief flashes of structure and form against a backdrop of seething complexity.

But that's getting ahead of the story. To understand chaos, we have to get to know its counterpoint. And that takes us back to the 17th century and some of the biggest names in the history of science.

The Birth of Determinism

The 1600s enjoyed a slow and steady illumination as a collection of visionary thinkers brought reason, form and structure to the great mysteries of the world. First came Johannes Kepler, the German astronomer who, in 1609 and 1618, described how planets moved in elliptical orbits with the sun as one focus of the ellipse. Next came Galileo Galilei, who made fundamental contributions to the scientific studies of motion, astronomy and optics throughout the early 1600s. These empirical concepts and ideas joined the inventive thinking of philosophers such as René Descartes. In 1641, Descartes published his Third Meditation, in which he discussed the principle of causality -- "nothing comes from nothing," or "every effect has a cause."

All of these ideas set the stage for Isaac Newton, whose laws of motion and gravitation shaped science for centuries to come. Newton's laws were so powerful that, if you were so inclined, you could use them to make predictions about an object far into the future, as long as you knew information about its initial conditions. For example, you could calculate precisely where the planets would be hundreds of years from the current date, making it possible to presage transits, eclipses and other astronomical phenomena. His equations were so powerful that scientists came to expect that nothing lay beyond their grasp. Everything in the universe could be determined -- calculated -- simply by plugging known values into the well-oiled mathematical machinery.

Advertisement

In the late 18th and early 19th centuries, a French physicist named Pierre-Simon Laplace pushed the concept of determinism into overdrive. He summarized his philosophy like this:

We ought then to regard the present state of the universe as the effect of its anterior state and as the cause of the one which is to follow. Given for one instant an intelligence which could comprehend all the forces by which nature is animated and the respective situation of the beings who compose it -- an intelligence sufficiently vast to submit these data to analysis -- it would embrace in the same formula the movements of the greatest bodies of the universe and those of the lightest atom; for it, nothing would be uncertain and the future, as the past, would be present to its eyes.

Using this notion, Laplace's colleague Urbain Jean Joseph Le Verrier correctly predicted the planet Neptune in 1846, relying not on direct observation but on mathematical inference. Englishman John Couch Adams had made the same prediction just a few months earlier [source: StarChild Team]. Other similar scientific achievements followed and fueled numerous technological advances, from steel and electricity to the telephone and telegraph, to steam engines and internal combustion.

But the structured, ordered world of Newton and Laplace was about to be challenged, albeit slowly, fitfully. The first seeds of chaos were planted by another Frenchman and with an analysis of a system that should have been a no-brainer -- the motion of planets.

This gets to a second key concept: uncertainty or scientific error. Even greenhorn Galileos accept the presence of uncertainty when making measurements, but they also assume they can reduce the uncertainty by measuring initial conditions with increasing accuracy. Much of 19th- and early-20th-century science occupied itself with improving the quality of measuring equipment, all in the pursuit of determinism.

Not So Certain After All: Dynamical Instability

By the end of the 19th century, scientists were becoming a little complacent. Newton's laws had proven to be extraordinarily robust, and everyone assumed they could solve any physical problem set before them. In addition to this sturdy mathematical foundation, astronomers were adding more information about Earth and its position in the solar system and beyond. An astronomical chart of 1900 would have displayed the eight principal planets, each in an elliptical orbit around the sun, as well as numerous satellites, the larger asteroids and a handful of comets. The same chart would have provided apparent magnitudes, orbital velocities, diameters and distances from the sun. In other words, it contained all of the information necessary to exploit Newton's equations and determine a future state of the planets.

In 1885, King Oscar II of Sweden and Norway offered a prize to anyone who could prove the stability of the solar system. It may have seemed like an unnecessary quest (after all, the solar system had obviously been stable for millions of years before the 1800s), but it had titillated scientists for years and, at the very least, it provided a means to demonstrate the power of classical mechanics. Several well-known mathematicians, including Leonhard Euhler, Joseph-Louis Lagrange and even Pierre-Simon Laplace himself, had tackled the problem before King Oscar's contest. A few managed to provide proofs of solar system stability, at least in short-term models. But no one had been able to prove, definitively, that the eight planets would stay in a bounded region of space for all time.

Advertisement

Enter Henri Poincaré, a French mathematician already known for innovative thinking before the contest attracted his attention. Instead of focusing on all planets and the sun simultaneously, Poincaré decided to limit his analysis to a smaller, simpler system -- two massive bodies orbiting one another around their common center of gravity while a much smaller body orbits them both. This is known as the n-body problem, which uses complex math to predict the motion of a group of celestial objects that interact gravitationally. That math usually involves differential equations -- equations that give the rate of change of a system as a function of its present state. But when Poincaré tried to describe the present state of the bodies in his simplified calculus, he discovered that small imprecisions -- rounding off a planet's mass, for example -- grew over time and became magnified at an alarming rate. Even when he shrunk the uncertainties in initial conditions to smaller and smaller values, the calculations still "blew up," producing enormous uncertainties in the final predictions. He concluded it was impossible to predict the future outcome of the solar system because the system itself was far too complex, filled with too many variables that could never be measured with absolute precision.

For his work, Poincaré won the contest. But his real accomplishment was to discover something known as dynamical instability, or chaos. It largely went unnoticed for another 70 years, until a meteorologist at the Massachusetts Institute of Technology (MIT) tried to use computers to improve weather forecasting.

Of Weather and Wings

It seems a strange juxtaposition today: In the 1960s, NASA was successfully launching astronauts into orbit while weather forecasters were struggling to make accurate predictions. In 1962 alone, two ferocious storms caught U.S. meteorologists with their proverbial pants down. The first, known as the Ash Wednesday Storm, came ashore on March 6 and nearly washed away some mid-Atlantic cities. When the nor'easter finally withdrew, 40 people were dead, and residents from North Carolina to New York faced $200 million dollars' worth of property damage [source: Dance]. The second storm -- the "Big Blow" -- struck the opposite coast on Oct. 12, battering California, Washington, Oregon and southwest Canada with near-hurricane-force winds. The Metropolitan Life Insurance Company declared the storm, which caused $230 to $280 million in damage, the worst natural disaster of 1962 [source: Read].

Many scientists believed that supercomputers held the key to avoiding similar weather catastrophes. Introduced in the '60s, these powerful, room-sized computers finally offered sufficient processing power to take a set of initial atmospheric conditions, crunch the numbers and spit out an accurate forecast.

Advertisement

A researcher at MIT, Edward Lorenz, had one of these early computers running in his office. Into this clumsy machine, Lorenz entered a streamlined computational model consisting of 12 meteorological calculations. The equations analyzed basic variables -- temperature, pressure, wind speed -- and spit out a simulated weather forecast. To "see" this weather, Lorenz would select one variable and then have the computer print out how that variable changed over time. In a bit of artistic flair, he directed the computer to print a certain number of blank spaces followed by the letter "a" in addition to simple numerical results. This produced a graphical representation of the variable being studied -- the letter "a" would meander across the page, just as capricious as the weather it was simulating.

One day in 1961, a particular output sequence caught Lorenz's eye. He decided to repeat the calculation, but to save time, he started from the middle of the run. Using the previous printout, he selected numbers halfway through the series to be his initial conditions. He entered these values, restarted the calculation and went away for some coffee. When he returned, he was astonished to find that the second run hadn't produced identical results as the first. The output pattern should have been the same, but the second graph diverged dramatically from the first after just a short time. Lorenz thought at first that his computer, notoriously finicky, wasn't working properly. Then he discovered the problem: The numbers he had entered from the printout only contained three digits, while the computer's memory allowed for six digits. This small discrepancy -- entering 0.506 versus 0.506127 -- was enough to introduce enormous unpredictability into the system.

Lorenz discovered with weather what Poincaré had discovered with interacting celestial bodies: certain complex systems exhibit sensitive dependence on initial conditions. Alter those conditions even slightly, and you'll produce wildly different results. Weather forecasting, Lorenz realized, was a futile effort at best because no one could ever quantify atmospheric conditions with certainty. To help people understand this concept, he invoked the idea of an animal flapping its wings, which would create a small area of turbulence, which would then be magnified over time and distance into catastrophic meteorological changes. At first, Lorenz favored the wings of a seagull. But in 1972, while preparing for a conference presentation, a colleague suggested he change his title to something a tad more poetic: "Predictability: Does the Flap of a Butterfly's Wings in Brazil Set Off a Tornado in Texas?" The image captivated the public, and soon the Butterfly Effect became the standing metaphor for the challenges of weather forecasting and for chaos itself.

Lorenz might have been satisfied with the results of his computer experiment, but he suspected he might be standing on the threshold of something bigger -- something profound. His now-famous "dishpan experiments" opened up the door to this wild and wonderful world we know today as chaos.

The Lorenz Attractor: A Portrait of Chaos

The weather model of meteorologist Edward Lorenz
Encyclopaedia Britannica/UIG/Getty Images

Lorenz's computer model distilled the complex behavior of Earth's atmosphere into 12 equations -- an oversimplification if there ever was one. But the MIT scientist needed something even simpler if he hoped to get a better look at the tantalizing effects he glimpsed in his simulated weather. He narrowed his problem to a single atmospheric condition known as rolling fluid convection. Convection occurs on a large scale when the sun heats air near Earth's surface faster than air higher in the atmosphere or over bodies of water. As a result of this uneven heating, warmer, lighter air rises as cooler, heavier air sinks. This in turn creates large circular "rolls" of air.

Convection also can occur on smaller scales -- in cups of hot coffee, in pans of warming water or in rectangular metal boxes heated from below. Lorenz imagined this latter small-scale example of rolling convection and set about deriving the simplest equations possible to describe the phenomenon. He came up with a set of three nonlinear equations:

Advertisement

  1. dx/dt = σ(y-x)
  2. dy/dt = ρx - y - xz
  3. dz/dt = xy - βz

where σ (sigma) represents the ratio of fluid viscosity to thermal conductivity, ρ (rho) represents the difference in temperature between the top and bottom of the system and β (beta) is the ratio of box width to box height. In addition, there are three time-evolving variables: x, which equals the convective flow; y, which equals the horizontal temperature distribution; and z, which equals the vertical temperature distribution.

The equations, with only three variables, looked simple to solve. Lorenz chose starting values -- σ = 10, ρ = 28 and β = 8/3 -- and fed them to his computer, which proceeded to calculate how the variables would change over time. To visualize the data, he used each three-number output as coordinates in three-dimensional space. What the computer drew was a wondrous curve with two overlapping spirals resembling butterfly wings or an owl's mask. The line making up the curve never intersected itself and never retraced its own path. Instead, it looped around forever and ever, sometimes spending time on one wing before switching to the other side. It was a picture of chaos, and while it showed randomness and unpredictability, it also showed a strange kind of order.

Scientists now refer to the mysterious picture as the Lorenz attractor. An attractor describes a state to which a dynamical system evolves after a long enough time. Systems that never reach this equilibrium, such as Lorenz's butterfly wings, are known as strange attractors. Additional strange attractors, corresponding to other equation sets that give rise to chaotic systems, have since been discovered. The Rössler attractor produces a graph that resembles a nautilus shell. The Hénon attractor produces an alien-looking boomerang.

As soon as Lorenz published the results of his work in 1963, the scientific community took notice. Images of his strange attractor begin appearing everywhere, and people talked, with more than a little excitement, about this unfolding frontier of science where indeterminism, not determinism, ruled. And yet the word chaos had not yet emerged as the label for this new area of study. That would come from a soft-spoken mathematician at the University of Maryland.

Population Biology and Bifurcation

While Edward Lorenz quietly studied the weather in Massachusetts, an Australian-born scientist named Robert May was trying to crack the code of a different field -- population biology. May wasn't a typical biologist, roaming fields and forests to catalog living things. Instead, he used mathematical techniques to model how animal populations might change over time given a certain set of starting conditions. His work led him to a useful formula, known as the logistic difference equation, that enabled him to predict animal populations reasonably well. The equation looked like this:

Xn+1 = rxn(1 - xn)

Advertisement

where r equals the driving parameter, the factor that causes the population to change, and xn represents the population of the species. To use the equation, you start with a fixed value of r and an initial value of x. Then you run the equation iteratively to obtain values of x1, x2, x3, all the way to xn.

As May worked with the equation in the early 1970s, he began to get confounding results. When the driving parameter r remained low, everything was fine -- the population settled to a single value. But when the driving parameter crept higher and higher, the results were all over the place.

May consulted with James Yorke, a friend and professor of mathematics at the University of Maryland. At about the same time, Yorke had seen Lorenz's paper in the Journal of the Atmospheric Sciences and believed that there might be a connection between weather and changing animal populations. He took the logistic difference equation and ran it through its paces.

He started with low values of r, just as May had, then he kept going higher and higher. As long as r remained below 3.0, xn converged to a single value. But when he set r equal to 3.0, xn oscillated between two values. On a map or diagram, this appeared as a single line dividing into two branches -- a bifurcation. Yorke kept taking the value of r even higher. As he did, xn experienced additional bifurcations, oscillating between four values, then eight, then 16. When the driving parameter equaled 3.569945672, xn neither converged nor oscillated -- it became completely random. And when r hit values greater than 3.569945672, xn exhibited complete randomness punctuated by "windows" of stability.

In 1975, Yorke and co-author T.Y. Li summarized their findings in "Period Three Implies Chaos," a landmark paper that introduced the world to the term "chaos" and "chaotic" behavior. As he stepped through the math of the logistic difference equation, he reaffirmed what Poincaré and Lorenz had already discovered -- that even simple systems governed by relatively simple equations could produce extraordinarily complex, unpredictable behavior. But he also caught a glimpse of order in his bifurcation diagrams. When he examined them closely, he could see patterns and repeatability. Other scientists of the day, such as Benoît Mandelbrot, were seeing similar things.

Fractals

A bifurcation diagram
Image courtesy William Harris/HowStuffWorks

If you examine a bifurcation diagram closely, you begin to see interesting patterns. For example, start with a completed diagram, such as the one in the first picture.

Next, zoom in on the first doubling point. It looks like a rounded, sideways V. Now look at the smaller, sideways V's that come next in the series.

Advertisement

Now zoom in again, say, on that upper, smaller V.

Notice how this region of the diagram looks like the original. In other words, the large-scale structure of the figure is repeated multiple times. The doubling regions exhibit a quality known as self-similarity -- small regions resemble large ones. Even if you look in the chaotic areas of the diagram (which occur to the right), you can find this quality.

Self-similarity is a property of a class of geometric objects known as fractals. The Polish-born mathematician Benoît Mandelbrot coined the term in 1975, after the Latin word fractus, which means "broken" or "fragmented." He also worked out the basic math of the objects and described their properties. In addition to self-similarity, fractals also possess something known as fractal dimension, a measure of their complexity. The dimension is not an integer -- 1, 2, 3 -- but a fraction. For example, a fractal line has a dimension between 1 and 2.

The beginnings of a Koch snowflake
Image courtesy William Harris/HowStuffWorks

The Koch snowflake -- named after the Swedish mathematician Helge van Koch -- stands as a classic example of a fractal. To derive the shape, van Koch established the following rules, first for a line:

  1. Divide a line segment into three equal parts
  2. Remove one-third of the segment out of the middle
  3. Replace the middle segment with two segments of the same length such that they all connect
  4. Repeat indefinitely on each line segment

The second picture shows what the first two iterations would look like:

If you start with an equilateral triangle and repeat the procedure, you end up with a snowflake that has a finite area and an infinite perimeter:

Eventually you wind up with something like this.
Image courtesy William Harris/HowStuffWorks

Today, fractals form part of the visual identity of chaos. As infinitely complex objects that are self-similar across all scales, they represent dynamical systems in all their glory. In fact Mandelbrot eventually proved that Lorenz's attractor was a fractal, as are most strange attractors. And they're not limited to the ruminations of scientists or the renderings of computers.

Fractals are found throughout nature -- in coastlines, seashells, rivers, clouds, snowflakes and tree bark. Before you take a field trip, however, be aware that self-similarity behaves a little differently in natural systems. In controlled mathematical environments, an object with self-similarity often displays an exact repetition of patterns at different magnifications. In nature, patterns obey statistical self-similarity -- they don't repeat exactly but parts of them show the same statistical properties at many different scales.

Chaos Today

For a while, in the 1980s and early 1990s, chaos was touted as the next big revolution in science, on par with quantum mechanics. Storytellers embraced its principles and worked them into their novels, films and plays. Almost everyone remembers how "Jurassic Park" treated chaos, with self-proclaimed chaotician Ian Malcolm letting drips of water run along Ellie Sattler's hand to prove that the liquid never takes the exact same path. In the Michael Crichton novel, which came out in 1990, chaos takes on even greater thematic importance. Crichton organizes the book into iterations, just like the iterations used to generate bifurcation diagrams and fractals. And Malcolm provides much deeper insights into the science of chaos than his onscreen persona:

You're going to engineer a bunch of prehistoric animals and set them on an island? Fine. A lovely dream. Charming. But it won't go as planned. It is inherently unpredictable. We have soothed ourselves into imagining sudden change as something that happens outside the normal order of things. An accident, like a car crash. Or beyond our control, like a fatal illness. We do not conceive a sudden, radical, irrational change as built into the very fabric of existence. Yet it is.

The same year Spielberg hit pay dirt with a dinosaur theme park run amok, Tom Stoppard published his play "Arcadia," which uses chaos theory as a vehicle to explore broader themes, such as the mystery of sex and the conflict of emotion with intellect. At one point, the character Valentine Coverly offers an explanation of chaos that any mathematician would appreciate: "If you knew the algorithm and fed it back say ten thousand times, each time there'd be a dot somewhere on the screen. You'd never know where to expect the next dot. But gradually you'd start to see this shape ..."

Advertisement

Then, despite all of this attention, chaos theory seemed to recede into the shadows. Some questioned whether the subject deserved all of the hype it received in the 1990s. But in reality, chaos is less of a new science than a progression in thinking, a shift in world views, from Newtonian determinism to nonlinear unpredictability. As such, the principles slowly uncovered by the likes of Poincaré, Lorenz, Smale, Young and others touch all of science, forming a lens through which problems in any discipline can be studied. One Harvard scientist puts it this way: "[Chaos] is a collection of tools, and it's a way of understanding phenomena that occur over a wide range of fields" [source: Ornes].

Medicine may be the next frontier to benefit from the insights of chaos. For example, physiologists have discovered that cardiac rhythm is extremely sensitive to initial conditions and that when heart rate becomes highly regular, the muscle tissue is less capable of adapting to demands, predisposing a person to arrhythmias and myocardial infarction. Researchers also suspect chaotic behavior in brain function and are trying to find links between a patient's cognitive power and his or her electroencephalogram (EEG), the record of brain activity produced by electroencephalography. Is it possible that your ability to perceive and analyze information is related to the fractal dimension of your EEG?

Perhaps one day, thanks to chaos, we'll know the answer. But don't count on getting any closer to having a reliable 10-day forecast. As much as we hate to admit it, some things are simply beyond the grasp of our Newtonian science.

Lots More Information

Author's Note: How Chaos Theory Works

Back in college, I took a course on population biology, thinking it would be like other ecology courses -- a little soft and mild-mannered. It ended up being one of the hardest classes I took as a biology major, filled with differential equations and complex concepts. I don't remember dynamical instability being discussed, but I suspect now, after writing this article, that we ventured regularly into the land of chaos. Had I not been so focused on making it through the course without wrecking my GPA, I might have seen some of those concepts for what they were -- manifestations of a fundamental, and sometimes frightening, shift in how we view the world.

Related Articles

  • Bradley, Larry. "Chaos and Fractals." Space Telescope Science Institute. Johns Hopkins University. 2010. (Jan. 14, 2013) http://www.stsci.edu/~lbradley/seminar/index.html
  • "Chaos : A pictorial introduction." La Trobe University. Jan. 12, 2000. (Jan. 14, 2013) http://johnbanks.maths.latrobe.edu.au/chaos/index.html
  • Dance, Scott. "50 years ago, Ocean City was washing away." The Baltimore Sun. March 5, 2012 (Jan. 14, 2013) http://www.baltimoresun.com/news/weather/bs-md-ash-wednesday-storm-20120305,0,3279194.story?page=1&track=rss
  • Dizikes, Peter. "The meaning of the butterfly." Boston.com. June 8, 2008. (Jan. 14, 2013) http://www.boston.com/bostonglobe/ideas/articles/2008/06/08/the_meaning_of_the_butterfly/?page=full
  • Elert, Glenn. "The Chaos Hypertextbook: Mathematics in the Age of the Computer." (Jan. 14, 2013) http://hypertextbook.com/chaos/
  • Fractal Foundation. "What is Chaos Theory?" (Jan. 14, 2013) http://fractalfoundation.org/resources/what-is-chaos-theory/
  • Gleick, James. "Chaos: Making a New Science." Open Road. 2011.
  • Laplace, Pierre-Simon. "A Philosophical Essay on Probabilities." Translated by Frederick Wilson Truscott and Frederick Lincoln Emory. John Wiley & Sons. 1902. (Feb. 4, 2014) https://archive.org/stream/philosophicaless00lapliala#page/4/mode/2up
  • Li, Tien-Yien and James A. Yorke. "Period Three Implies Chaos." The American Mathematical Monthly. Vol. 82, No. 10 (Dec. 1975). (Feb. 4, 2014) http://www.its.caltech.edu/~matilde/LiYorke.pdf
  • Oestreicher, Christian. "A history of chaos theory." Dialogues in Clinical Neuroscience. 2007.
  • Ornes, Stephen. "Whatever Happened to ... Chaos Theory?" Discover Magazine. April 4, 2007. (Jan. 14, 2013) http://discovermagazine.com/2007/apr/whatever-happened-to-chaos-theory#.UPS90HBGJ5Q
  • Read, Wolf. "The Big Blow of Columbus Day 1962." University of Washington. Feb. 9, 2005. (Jan. 14, 2013) http://www.climate.washington.edu/stormking/October1962.html
  • The StarChild Team. "Urbain Le Verrier." NASA/GSFC. (Feb. 4, 2014) http://starchild.gsfc.nasa.gov/docs/StarChild/whos_who_level2/leverrier.html
  • Taylor, Richard P. "Order in Pollock's Chaos." Scientific American. December 2002.
  • Trump, Matthew A. "What is Chaos?" Ilya Prigogine Center for Studies in Statistical Mechanics and Complex Systems, University of Texas. Aug. 14, 1998. (Jan. 14, 2013) http://order.ph.utexas.edu/chaos/
  • Wang, W. "Bifurcation." Encyclopedia of Ecology, Volume One. Elsevier. 2008.