If you're interested at all in the natural history of Earth, you may already be familiar with the concept of plate tectonics — that is, that the outermost layer of our planet, the lithosphere, actually is a collection of rigid plates that continually shift and slide into each other, as they try to adjust to the movement of semi-molten rock flowing in the mantle layer beneath them. That means that Earth's land masses are continually on the move, too, so that tens or hundreds of millions of years ago, a particular present-day address most likely was in faraway spot elsewhere on the globe.
If you live in New York City, for example, you might be surprised to learn that 240 million years ago during the Early Triassic epoch, your city was located in the middle of an immense ancient supercontinent called Pangea, which included almost all of the planet's land mass. Go back 500 million years ago to the Late Cambrian period, when the diversity of aquatic animals was expanding explosively, and the city that never sleeps was underwater. Some 750 million years ago, it was aboveground again as part of yet another supercontinent, Rodinia, which was in the later stages of breaking up.
Advertisement
You can trace where a particular location on Earth was located tens or hundreds of millions of years ago by using an ingenious online tool called the Ancient Earth simulation. It allows you to type in the name of a city, highlight it, and then select an ancient date from a drop-down menu to see where it was back at some point in the distant past.
Ancient Earth was created by Ian Webster, a software engineer who is the founder and chief technology officer of Zenysis, a San Francisco-based company that does analytics and visualizations of data designed to improve the delivery of health care in developing countries. He previously worked as an engineer at Google and also at NASA and for other companies in the space industry. He's also the creator of Dinosaurpictures.org, which allows you to search through a database of images of the ancient creatures, and even view a random dinosaur.
In addition to being interested in paleogeography, Webster also likes to explore the power of turning data into images.
"There's so much fascinating science that is more easily understood through visualization," he explains in an email. "These visualizations are a great way to convey information that would otherwise be difficult to conceptualize, both for the average person and even for scientists. Around 2012, a browser graphics technology called WebGL started to become more mainstream, and I've sought interesting opportunities for scientific visualization since then. Some examples of my previous work on science visualization show how meteor showers form or what the structure of the universe looks like."
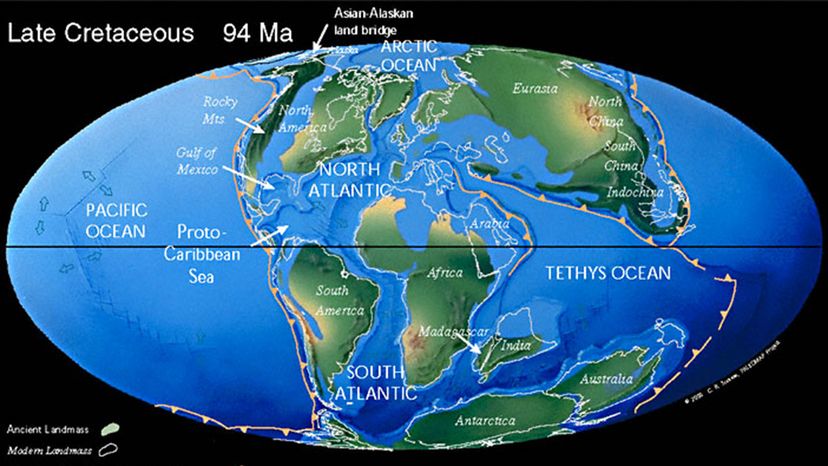
To create the Ancient Earth visualization, Webster drew upon the work of paleogeographer Christopher Scotese, whose PALEOMAP Project illustrates the plate tectonic development of ocean basins and continents over a 1.1 billion-year period. Paleogeographers use a variety of methods to figure out where land was in the ancient past, including measuring the remnants of ancient magnetic fields in iron-bearing rock formations.
"Dr. Scotese's work is available online in a format compatible with GPlates, desktop software used by geologists for plate tectonics visualization," Webster explains. "I found his work after doing some research on the best sources for paleogeographic maps. Building the visualization also involved writing some content and determining how to geocode addresses and run the plate tectonics transformations backwards. Once I had developed it, I reached out to Chris and he has been extremely helpful in allowing me to use his work, providing suggestions and improvements for the visualization.
"The most challenging part was definitely figuring out how to geocode addresses and run them backwards through plate tectonic transformations," he says. "It was a great problem that helped me understand how science currently understands plate tectonics."
While the web visualization is a cool tool to play around with, Webster has a serious science education aim as well. "I'm hoping that Ancient Earth will give people a broader perspective of Earth on a cosmological timescale. These geological processes have been underway for far longer than we can imagine. I also hope that the project communicates an appreciation for the science that allows us to understand the Earth's past."
Advertisement