Mass and Movement
In 1924, the astronomer A. S. Eddington showed that the luminosity and mass of a star were related. The larger a star (i.e., more massive) is, the more luminous it is (luminosity = mass3).
Stars around us are moving with respect to our solar system. Some are moving away from us and some are moving toward us. The movement of stars affects the wavelengths of light that we receive from them, much like the high-pitched sound from a fire truck siren gets lower as the truck moves past you. This phenomenon is called the Doppler effect. By measuring the star's spectrum and comparing it to the spectrum of a standard lamp, then the amount of the Doppler shift can be measured. The amount of the Doppler shift tells us how fast the star is moving relative to us. In addition, the direction of the Doppler shift can tell us the direction of the star's movement. If the spectrum of a star is shifted to the blue end, then the star is moving toward us; if the spectrum is shifted to the red end, then the star is moving away from us. Likewise, if a star is spinning on its axis, the Doppler shift of its spectrum can be used to measure its rate of rotation.
Advertisement
So you can see that we can tell quite a bit about a star from the light that it emits. Furthermore, amateur astronomers today have devices like large telescopes, CCDs and spectroscopes commercially available to them at relatively low cost. Therefore, amateurs can do the same types of measurements and stellar research that used to be done by professionals alone.
Classifying Stars: Putting the Properties Together
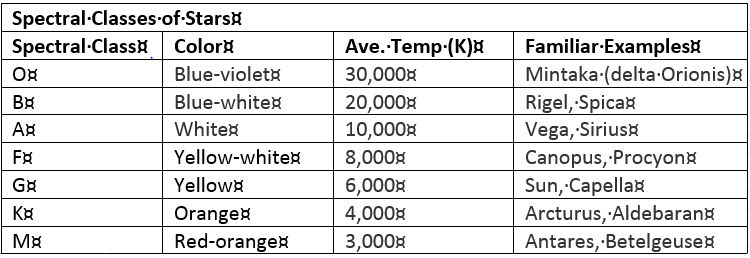
In the early 1900s, two astronomers, Annie Jump Cannon and Cecilia Payne, classified the spectra of stars according to their temperatures. Cannon actually did the classification and Payne later explained that a star's spectral class was indeed determined by the temperature.
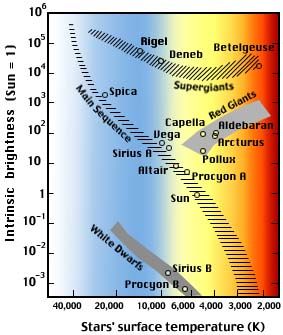
In 1912, Danish astronomer Ejnar Hertzsprung and American astronomer Henry Norris Russell independently graphed the luminosity vs. temperatures for thousands of stars and found a surprising relationship as shown below. This diagram called a Hertsprung-Russell or H-R diagram revealed that most of the stars lie along a smooth diagonal curve called the main sequence with hot, luminous stars in the upper left and cool, dim stars in the lower right. Off of the main sequence, there are cool, bright stars in the upper right and hot, dim stars in the lower left.
If we apply the relationship between luminosity and radius to the H-R diagram, we find that the radius of the stars increases as you proceed bottom left diagonally to top right:
- Sirius B = 0.01 solar radius
- Sun = 1 solar radius
- Spica = 10 solar radii
- Rigel = 100 solar radii
- Betelgeuse = 1000 solar radii
If you apply the relationship between mass and luminosity to the H-R diagram, you find that stars along the main sequence vary from the highest (approximately 30 solar masses) at the top left to the lowest (approximately 0.1 solar mass) at the bottom right. As you can see from the H-R diagram, our sun is an average star.
The table summarizes the types of stars in the universe according to luminosity:
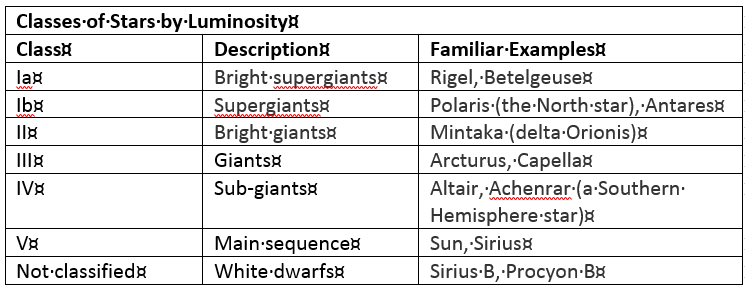
White dwarfs stars are not classified because their stellar spectra are different from most other stars. The H-R diagram is also useful for understanding the evolution of stars from birth to death.